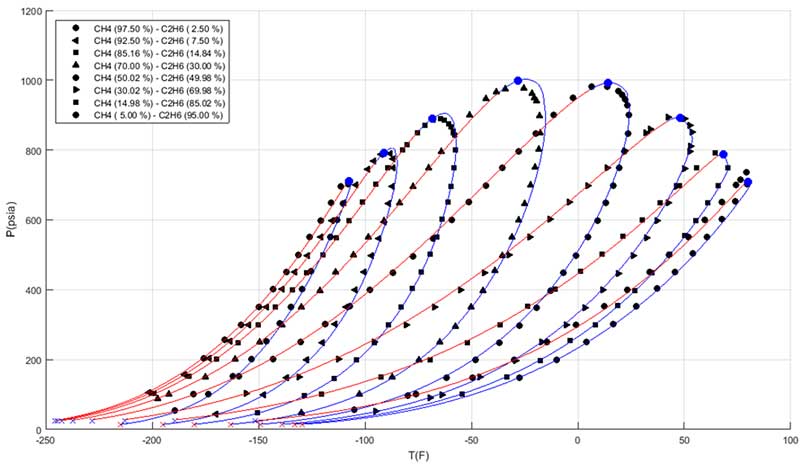
This plot shows hydrocarbon fluid phase envelope at various molar concentrations of methane and ethane. The black data points are experimental data points from the Institute of Gas Technology (IGT). The blue dots are critical points, the red and blue lines represent bubble point and dew point lines respectively. The critical point, bubble and dew point lines were generated using a hydrocarbon fluid phase behavior model (PBM).
Trained Consultants For Any Geological Environment
- Blending the knowledge of petroleum systems, computational modeling, and data analytics to provide industry standard solutions that reduce cost, optimize operations, and empower decision makers.
- Production forecasting and reserve estimation
- Production estimation and EOR
- Reservoir modeling and simulation
- Drilling hydraulics and hydraulic fracturing designs
- Data science applications to petroleum systems